Analyze and Optimize Vite Bundle Size Using rollup-plugin-visualizer
Vite is widely known for its speed and simplicity in building modern frontend applications. But as your project scales, so does your JavaScript bundle, and that’s when performance can start to suffer.
One of the most effective tools for identifying what’s inflating your bundle size is rollup-plugin-visualizer. It offers a visual breakdown of your production build, highlighting large dependencies, duplicate modules, and how your code is split. Think of it as a bundle inspection tool that helps you quickly spot performance bottlenecks.
Here’s how you can set it up in a Vite project and how to interpret its output to optimize your final bundle.
Prerequisite
This guide assumes you already have a Vite project up and running. We won’t cover project setup here. If you’re using Rollup instead, most of the same steps still apply.
Steps
Install the Visualizer Plugin
Run the following command to install rollup-plugin-visualizer as a dev dependency:
npm install --save-dev rollup-plugin-visualizerAdd the Plugin to Your vite.config.ts
Import and configure the plugin within your Vite config file. It’s best to add it as the last item in your plugins array:
import { visualizer } from 'rollup-plugin-visualizer'
export default defineConfig({  plugins: [    // other plugins...    visualizer()  ]})
Build Your Project
To generate the visualization, simply run your production build:
npm run buildThis will generate a stats.html file (in the same directory as your vite.config.ts) which you can open in a browser to inspect your bundle.
Example
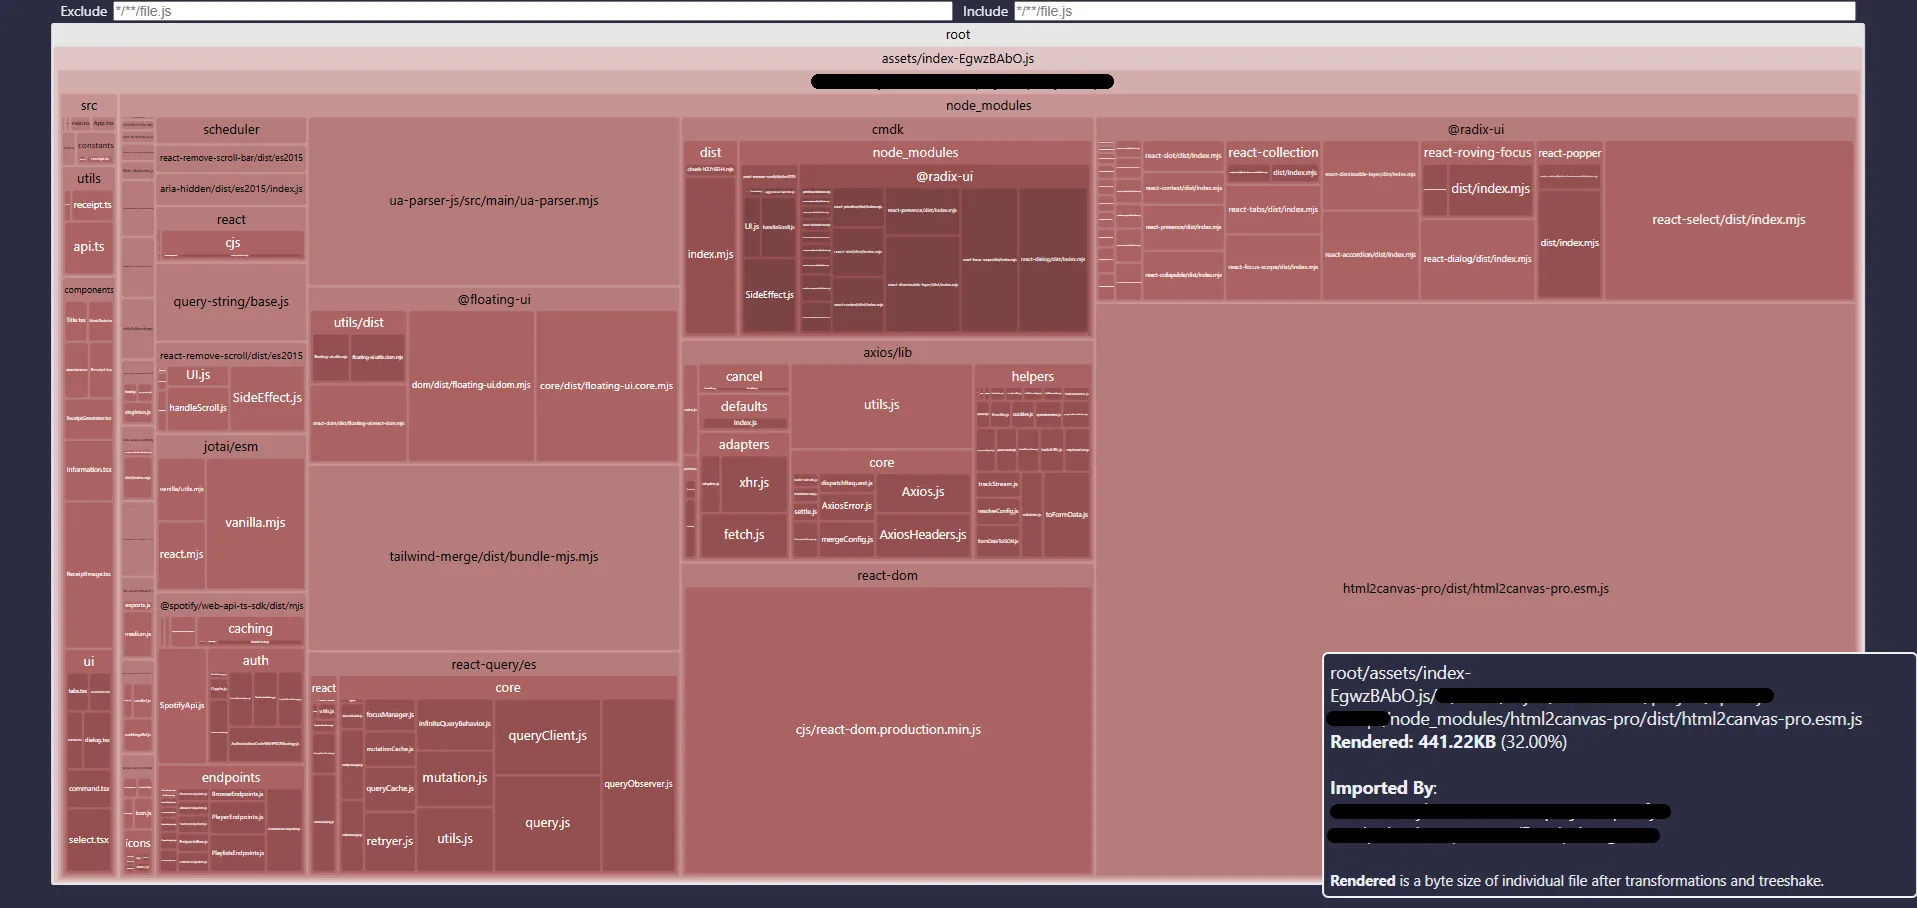
The visualization above comes from one of my projects, Spoticeipt. It clearly shows that html2canvas is the largest dependency, occupying a significant portion of the total bundle.
The plugin estimates a total uncompressed bundle size of about 1.35MB. However, the actual size served after gzip compression is roughly 660KB. Based on this ratio, html2canvas likely contributes around 215KB to the final output.
This insight can drive important decisions. For example, I may consider replacing html2canvas with a smaller alternative or implement only the necessary features manually to minimize bloat.
Why This Matters
Having a clear view of your bundle composition allows you to:
- Identify large third-party dependencies
- Detect duplicated code or modules
- Optimize for performance through lazy loading, tree-shaking, or library replacement
In short, rollup-plugin-visualizer helps you move from guesswork to data-driven performance tuning. If you’re aiming for fast load times and better Lighthouse scores, this tool is a must-have in your Vite optimization workflow.